 Stock Chart


Overview
Stock Chart is a Chrome extension developed by lok960821.
According to the data from Chrome web store, current version of Stock Chart is 1.0, updated on 2018-10-01.
601 users have installed this extension.
6 users have rated this extension with an average rating of .
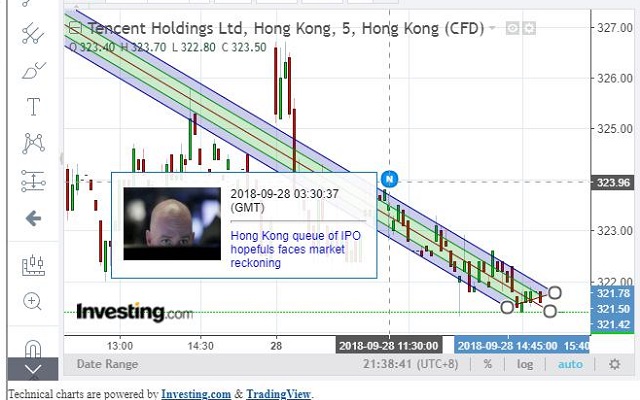
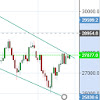
Stock Chart provide Technical Charts Analysis for forecasting stock, index of future price. Stock Chart 提供技術圖表分析工具,協助用家以估計股票或指數未來趨勢。
Real time Stock/Future/Index Technical Charts Analysis.
即時股票/期貨/指數的技術圖表分析工具
Function:
Drawing Tools
Real time price
Take Photo for your Chart
News of the Stock
功能:
畫圖工具
即時價位
輸出畫圖後的圖表
股票新聞
即月期 代號 HK50
HSI 代號 HONG KONG:HK50
港股搜尋格式:(XXXX) e.g. 0700
因圖表是由Investing.com輸出,有些港股未能顯示出來
可以在 左上角Search
This Chrome Extension are Copyright © 2018 by [email protected]
Technical charts are powered by Investing.com & TradingView
Stock Chart Alternatives


Latest Reviews
See More|
2021-09-29
Absolut brauchbar . Gute Candlestick Charts |
|
2018-10-02
很多股票(港股)入不到,例如: 匯豐銀行0005; |
|
2018-10-01
very useful and great tools, thanks PoolestDeveloper! |
|
2021-09-29
Absolut brauchbar . Gute Candlestick Charts |
|
2018-10-02
很多股票(港股)入不到,例如: 匯豐銀行0005; |