Stock Chart v2

Overview
Stock Chart v2 is a Chrome extension developed by lok960821.
According to the data from Chrome web store, current version of Stock Chart v2 is 1.0, updated on 2018-10-03.
290 users have installed this extension.
1 users have rated this extension with an average rating of .
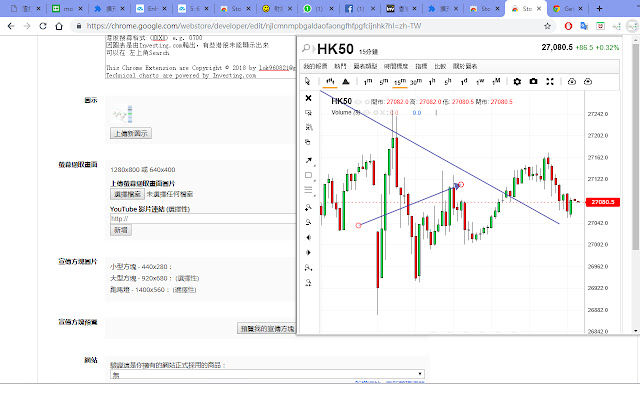
Stock Chart provide Technical Charts Analysis for forecasting stock, index of future price. Stock Chart 提供技術圖表分析工具,協助用家以估計股票或指數未來趨勢。
互動圖表
Stock Chart provide Technical Charts Analysis for forecasting stock, index of future price. Stock Chart 提供技術圖表分析工具,協助用家以估計股票或指數未來趨勢。
Real time Stock/Future/Index Technical Charts Analysis.
即時股票/期貨/指數的技術圖表分析工具
Function:
Drawing Tools
Real time price
Take Photo for your Chart
News of the Stock
功能:
畫圖工具
即時價位
輸出畫圖後的圖表
股票新聞
即月期 代號 HK50
HSI 代號 HONG KONG:HK50
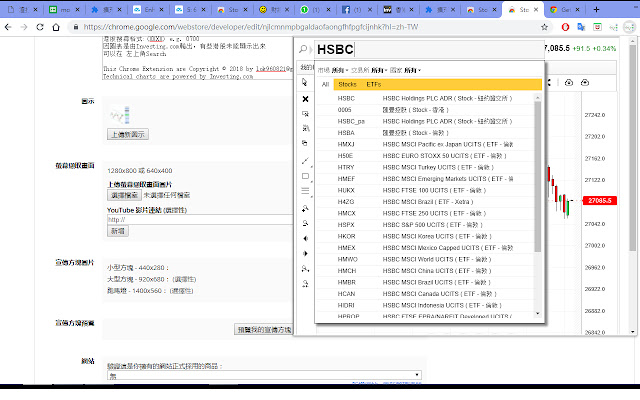
港股搜尋格式:(XXXX) e.g. 0700
因圖表是由Investing.com輸出,有些港股未能顯示出來
可以在 左上角Search
This Chrome Extension are Copyright © 2018 by [email protected]
Technical charts are powered by Investing.com