 Vernier Graphical Analysis


Overview
Vernier Graphical Analysis is a Chrome extension developed by Vernier Software & Technology.
According to the data from Chrome web store, current version of Vernier Graphical Analysis is 5.16.0-2915, updated on 2023-03-10.
0 users have installed this extension.
96 users have rated this extension with an average rating of .
developer website: graphicalanalysis.app
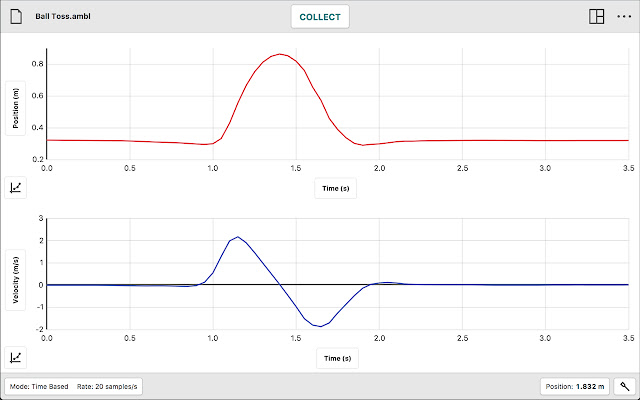
Graphical Analysis™ is a tool for science students to collect, graph, and analyze data from Vernier sensors.
New in release:
* Enhanced annotations functionality allows user to associate an annotation with a data point or a range of data.
* 31 additional calculated columns now available.
* If a Graphical Analysis Pro activation code is entered instead of license key, a descriptive error message is displayed.
* Improved file fidelity to more closely restore full state upon file open./
* Event-based data collection stability improvements.
Graphical Analysis™ is a tool for science students to collect, graph, and analyze data from Vernier sensors.
Sensor data-collection support:
• Vernier Go Direct® sensors - with Bluetooth® wireless technology and USB connectivity
• Vernier Go Wireless® Heart Rate and Go Wireless Exercise Heart Rate monitors
• Vernier LabQuest® sensors used with LabQuest 3, LabQuest 2, LabQuest Stream, LabQuest Mini, or Go!Link® interfaces
• Vernier Go!Temp® and Go!Motion® USB sensors
Additional experiment options:
• Data Sharing via Wi-Fi connection to LabQuest 2 or Logger Pro® 3
• Manual Entry
Note: Sensor data collection and Data Sharing require the purchase of hardware from Vernier Software & Technology. Manual entry of data can be performed without a hardware purchase. For more information on Data Sharing, visit http://www.vernier.com/css
Key Features - Data Collection
• Multi-sensor data-collection support
• Time Based, Event Based, Drop Counting, and Photogate data-collection modes
• Configurable data-collection rate and duration for time-based data collection
• Optional triggering of time-based data collection based on sensor value
• Customizable unit display on supported sensors
• Sensor calibrations
• Option to zero and reverse sensor readings
• Graph match feature for use with motion detectors
• Manual entry of data from keyboard and clipboard
Key Features - Data Analysis
• Display one, two, or three graphs simultaneously
• View data in a table or show a graph and table side-by-side
• Draw Predictions on a graph to uncover misconceptions
• Examine, interpolate/extrapolate, and select data
• Use Tangent tool to show instantaneous rates of change of the data
• Find area under a curve using the Integral tool
• Apply Statistics calculations to find mean, min, max, and standard deviation
• Perform curve fits, including linear, quadratic, natural exponent, and more
• Add calculated columns based on existing data to linearize data or investigate related concepts
Key Features - Collaboration and Sharing
• Create text annotations and add graph titles
• Export graphs and data for printing and inclusion in lab reports
• Save files (.gambl file format) to the Cloud for exchange with Graphical Analysis on other Chromebooks™, Windows® and macOS® computers, and iOS and Android™ devices
• Export data in .CSV format for analysis of data in spreadsheet software such as Excel, Google Sheets, and Numbers
• Adjust font sizes for easier viewing when presenting to your class
Vernier Software & Technology has over 35 years of experience in providing effective learning resources for understanding experimental data in science and math classrooms. Graphical Analysis is a part of the extensive system of sensors, interfaces, and data-collection software from Vernier for science and STEM education.
Vernier Graphical Analysis Alternatives
| Name | Category | Rating | Rating Count | Installs |
|---|---|---|---|---|
 TestNav
|
Academic Resources | (65) | 0 | |
 Vernier Graphical Analysis
|
Academic Resources | (96) | 0 | |
 GeoGebra Classic
|
Academic Resources | (1981) | 0 | |
 Istation
|
Academic Resources | (171) | 0 | |
 Stop Motion Animator
|
Academic Resources | (193) | 0 | |
 Desmos Test Mode
|
Academic Resources | (16) | 0 | |
 Destiny Discover
|
Academic Resources | (12) | 0 | |
 Achieve3000 Mobile
|
Academic Resources | (15) | 0 | |
 myON
myON
|
Academic Resources | (33) | 0 | |
 NWEA Secure Testing
|
Academic Resources | (40) | 300,000+ | |
 MackinVIA
|
Academic Resources | (7) | 0 | |
 myHomework Student Planner
|
Academic Resources | (905) | 0 | |
 Learn iLit
|
Academic Resources | (0) | 0 | |
 Schoolnet Secure Tester
|
Academic Resources | (7) | 0 | |
 miniPCR
|
Academic Resources | (2) | 0 | |
 Illuminate Secure Browser
|
Academic Resources | (0) | 0 | |
 OSTP for Chrome
|
Academic Resources | (2) | 0 | |
 GeoGebra Graphing Calculator
|
Academic Resources | (24) | 0 | |
 Docs Offline
|
Academic Resources | (3) | 0 | |
 Lexia Power Up
|
Academic Resources | (0) | 0 | |
 iReady
|
Academic Resources | (2) | 0 | |
 Chromeduino 2
|
Academic Resources | (38) | 0 | |
 INFOhio
|
Academic Resources | (4) | 0 | |
 SVA Read 180 Kiosk Mode
|
Academic Resources | (1) | 0 |
Latest Reviews
See More|
2021-09-29
what was mr. z on this app is trash lmao |
|
2021-05-13
im using this for science help |
|
2021-03-02
This is actually more responsive than the android app. I was having trouble adding a new calculated column on the android app and this chrome app works perfect. I will be using this for the rest of the semester. |
|
2019-08-21
It doesn't even work. Terrible in comparison to desmos and other graphing apps. Do not use it. |
|
2019-08-15
trash app |