 tickertape MMI
Overview
tickertape MMI is a Chrome extension developed by Ratan Kumar.
According to the data from Chrome web store, current version of tickertape MMI is 1.0.3, updated on 2020-04-15.
941 users have installed this extension.
8 users have rated this extension with an average rating of .
developer website: ratankumar.org
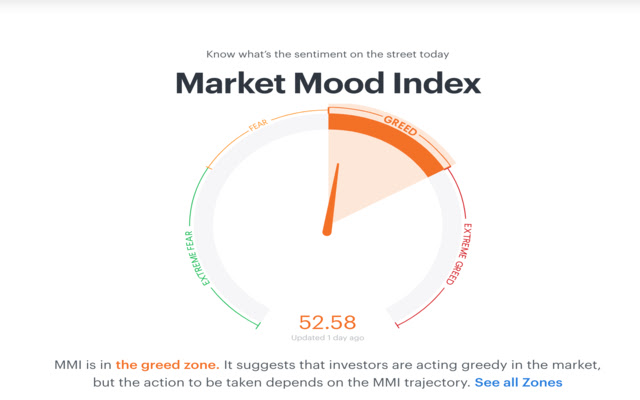
tickertape Market Mood Index
(Unofficial)
The MMI is an investor sentiment tool that describes the current mood of the market.
MMI takes into account 7 important factors to give a complete 360 degree picture of the emotions driving the market.
FII Activity
This is the net open interest of FIIs in Index Futures on the NSE. Tracking movement in this indicator gives insight into FII views about the markets
Higher than average value suggests bullish FII view about the market
Volatility
Volatility is measured by the India VIX index. It is the implied volatility of 1 month Nifty options and is a measure of the market's expectation of volatility in the near term
High VIX value suggests that market participants are expecting increased risk and volatility in the market
Skew
Volatility only tells us that the markets are expecting some movement, but doesn't tell us anything about the direction. Skew is used to measure the expectations around market direction. It is calculated as the difference between implied volatilities (IV) of OTM put options and OTM call options of Nifty
So, a higher than average value of skew represents a high chance of downward movement
Momentum
It is the difference between 90D & 30D exponential moving averages of Nifty, divided by 90D moving average
A positive value indicates an uptrend and vice versa
Market Breadth
It is calculated by dividing AD Ratio by AD Volume (Modified Arms Index)
A relative low value indicates strong market move supported by volumes
Price Strength
It is tracked by subtracting % of stocks near their 52W low from % of stocks near their 52W high to calculate the net % of stocks near their 52W high
Higher value indicates better price strength in the market
Demand for Gold
It is the relative price return of Gold vs Nifty for last 2 weeks
If the return of gold is increasing relative to Nifty, it indicates a movement away from equities into safer commodities like Gold
tickertape MMI Alternatives


Latest Reviews
See More|
2021-07-21
not working anymore |
|
2018-01-16
excellent , dont need to open website |
|
2017-11-28
Keeps you updated on the Indian Market Mood. Good way to know when to invest and when to book profits. |
|
2021-07-21
not working anymore |
|
2018-01-16
excellent , dont need to open website |