 Perforator - Ember Performance Extension


Overview
Perforator - Ember Performance Extension is a Chrome extension developed by Edelman.
According to the data from Chrome web store, current version of Perforator - Ember Performance Extension is 0.0.4, updated on 2015-10-27.
292 users have installed this extension.
7 users have rated this extension with an average rating of .
Ember.js app performance tool. See on page, console, and devtools timeline where performance bottlenecks are. Developed by LinkedIn.
NOTE: Your Chrome version must be at least 44 (for ES6 support) and your Ember version must be at least 1.10 (for components).
KNOWN ISSUE: Time tags occasionally won't show up if you load your Ember asynchronously. I'm working on it, but you should be able tp navigate to another route if you'd like to see them.
Perforator will help you determine your Ember.js app's performance bottlenecks. When activated, Perforator will time the rendering time of your Ember components and give you several ways to dig in to investigate individual components.
Main features include:
- In-page overlay of the render time for your components, colorized by relative speed. See at a glance what is taking so long! Hovering the tabs shows the component's classes and ember ID's. Clicking on the tag scootches it a bit :)
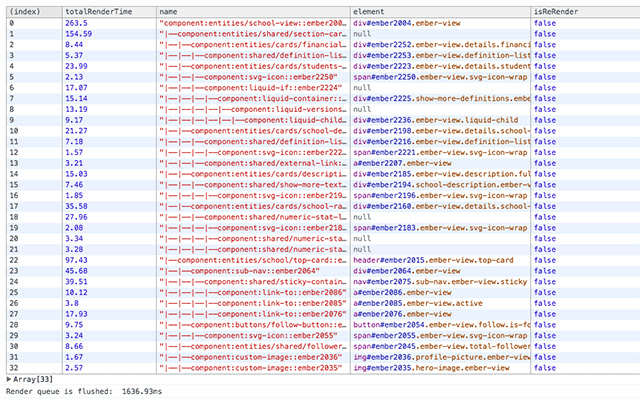
- Sortable table of useful rendering stats and information inside your dev tools console.
- A visual hierarchy of components as they are rendered inside the "Timeline" tab in your dev tools (scroll down to the "console" row label inside the "Timeline" tab).
The browser icon and popup provide some useful information as well:
- Icon is colorized when Ember is present on the page, grayscale otherwise.
- When Ember is present, clicking the browser icon pulls up a popup window that will allow you to turn Perforator on and off (for when you aren't doing performance tuning!), *which will refresh the page*
- Popup has a button for you to toggle the visible state of the timer tags on the in-page overlay.
No personal information is required or harvested, and no calls are made to a remote server (check the code!). No reliance on jQuery or any framework other than Ember.
Proudly developed at LinkedIn!
Perforator - Ember Performance Extension Alternatives


Latest Reviews
See More|
2018-09-24
Does not work. console.timeline is not a function. I believe they were trying for console.timeStamp(); |
|
2017-11-17
Works on Ember 2.16 for me. |
|
2016-07-07
Is this compatible with the newest versions of Ember? |
|
2015-10-24
The functionality this extension provides is excellent. I just can't figure out how to disable it aside from disabling the extension globally. Would be nice to have a way to quickly toggle the extension. |
|
2015-10-23
Wow. Ember can be hard to debug. By providing timing insights to components, this extension helps a lot. Great complement to Chrome's DevTools. Thank you so much!! |